NanoPhotometer C40 Touch
Cuvette Spectroscopy with standard and Microvolume cuvettes (quartz, glass and plastic) covering all applications.

Product Description
The C40 NanoPhotometer is designed for open measurements: don’t lose time with closing a lid for each reading. With its temperature controlled cuvette holder it is ideal for all UV/Vis spectroscopy applications including kinetics. The cuvette holder is optimized for all standard cuvettes (quartz, glass and plastic) with a center height of 8.5 mm.
Preprogrammed Apps
Preprogrammed applications are available for OD600 (Cell, Bacterial, Yeast Density), Bradford, BCA, dsDNA, ssDNA, RNA, mRNA, miRNA, Oligos, Proteins, and Antibodies including dye-labeled samples, small molecules, kinetics, and more.
Rapid Scan Capability
Turn on and instantly measure without lamp warm-up time. Full scan capability from 200 - 900 nm provides rapid and complete sample analysis in only 3.5 seconds.
Processing Power & Ease of Use
The NanoPhotometer C40 is operated by an integrated computer with a high performance Intel Celeron dual core 2.4 GHz processor and 64 GB of onboard memory provide powerful analysis and easy storage of methods and data. The built-in 7 inch LCD glove compatible touchscreen allows convenient stand-alone operation.
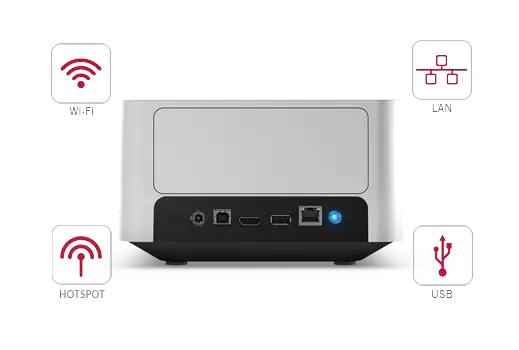
Endless Connectivity
Equipped with Wi-Fi, built-In HotSpot, LAN, and USB A/B interface connections for remote instrument control, data accessibility, and printing. The NPOS operating system supports AirPrint/IPP compatible printers supporting PDF format, printers compatible with the HP universal driver, and DYMO label printers (cryo and standard labels). The NanoPhotometer C40 is also compatible with 1 and 2D bar code readers allowing for flexible and streamlined data entry. Unique file server functionality allows access to data stored on the NanoPhotometer drive from any computer accessing the lab network.
Flexible Unit Control
Mobile and easy control of the NanoPhotometer® is possible via Wi-Fi from tablets or smartphones (Android OS & iOS). Easy control from PCs (Windows & Mac) with fast and flexible connection options including Wi-Fi, USB and LAN.
Universal Data Output
Every NanoPhotometer® is able to generate formatted Excel and PDF document files for data processing or archiving of measurements on the lab network. The capability to print full page reports, labels and cryo labels via USB and through a network connection lends users the upmost flexibility for data output.
Ultimate Data Security
Malware, viruses and ransomware are serious threats to instrumentation working on Android or Windows based platforms. The proprietary NanoPhotometer® Operating System NPOS protects data in a secure environment immune to known malicious software. Whether running Apps on the NanoPhotometer/control device or downloading precious measurement results, your data is safe. For additional security the NanoPhotometer® does not allow browsing on the internet whilst providing safe access to control devices like computers, tablets and smart phones.
Maintenance Free
Sealed optics without any moving parts eliminates the need for costly and time consuming recalibrations. Durable, inert surfaces provide an easy to clean maintenance free design. Compatible with Worldwide Pharmacopeia Requirements. 1.8 nm bandwidth built in. IQ/OQ package and FDA 21 CFR Part 11 compliant software available.
Mobile Design
Spectroscopy can now be taken anywhere. The optional integrated battery pack (NanoPhotometer C40 Touch Mobile) provides up to 8 hours of stand-alone battery powered operation.
Limitless Spectroscopy Applications
Nucleic Acids - The Nucleic Acids Method provides one-step easy analysis allowing quantitation and purity check of dsDNA, ssDNA, RNA, mRNA, miRNA as well as Oligonucleotides. In this method, it is also possible to determine the dye concentration and frequency of dye incorporation for dye conjugated nucleic acids. For each measurement, the concentration calculated as well as the 260:230 and 260:280 purity ratios. In addition to a full scan graph, a full table with raw data points is provided.
Proteins - The Protein UV Method allows for protein quantitation and purity check (BSA, Antibodies, IgG, IgE, Serum Albumin, etc.) using direct A280 measurements. In this method is also possible to select from pre-programmed dye labels as well as to create custom dye methods to determine the degree of labeling of dye conjugated proteins. For each measurement results can be provided as an OD1 value or the concentration can be calculated based on the extinction coefficient for the selected protein at 280 nm. In addition to a full scan graph, a full table with raw data points is also provided.
Protein Assays - In the protein assays method it is possible to quantify proteins using colorimetric assays including the BCA, Bradford, Lowry, and Biuret assays.
Kinetics - The Kinetics Methods allows for the measurement of change in absorbance as a function of time at a fixed wavelength in a drop or in a cuvette. Kinetic studies are routinely used for a variety of applications including the enzymatic determination of compounds in food, beverage, and clinical laboratories. Absorbance (An) for each measurement point, delta A (difference between start and last absorbance), slope, and correlation coefficient (calculated from linear regression of the data points) are displayed.
OD600 Cell Density - The OD600 Method is used to determine the absorbance at 600 nm. Bacterial cell cultures are routinely grown until the absorbance at 600 nm (known as OD600; default setting) reaches approximately 0.4 prior to induction or harvesting. A linear relationship exists between cell number (density) and OD 600 up to approx. 0.6.
Wavelength - The Wavelength Method allows for measurement of simple absorbance (Abs) or transmission (%T) at a single user defined wavelength. The results window shows the amount of light passed through the sample relative to the reference.
Wavescan - The Wavescan Method records the absorption (Abs) or transmission (%T) spectrum for the range between two user defined wavelengths. The spectral plot allows simple identification of peak height and position. The curve interpretation of the entire spectrum provides most detailed information for a sample.1
Absorbance Ratio - The absorbance Ratio Method can be used to measure the ratio between two user defined wavelengths.
Concentration - The Concentration Method determines the concentration of samples from a single wavelength absorbance reading. The amount of light that has passed through a sample relative to a reference is multiplied by a factor to obtain the concentration. The factor may be a known figure, or may be calculated by the instrument by measuring a standard of known concentration.
Standard Curve - The Standard Curve Method can be utilized to generate a standard curve at a single user specified wavelength. The preparation of a multi-point calibration curve from standards of known concentration to quantify unknown samples is a fundamental use of a spectrophotometer; the NanoPhotomer® has the advantage of being able to store this curve as a method to be recalled for future experiments.
Custom Apps - Fully customizable application development is possible with the proprietary NanoPhotometer® Operating System. Please contact Implen team for more information about custom app design to meet your individual application needs.
References
- Cristina Mozaceanu, Christopher G. P. Taylor, Jerico R. Piper, Stephen P. Argent and Michael D. Ward (2020) Catalysis of an Aldol Condensation Using a Coordination Cage Chemistry
- Ryunosuke Shimura, Hiroya Abe, Hiroshi Yabu, Mei-Fang Chien, Chihiro Inoue (2020) Biomimetic antibiofouling oil infused honeycomb films fabricated using breath figures Polymer Journal
- Mohammad A. Haquea, Riku Imamurab, George A. Browna, Venkata R. Krishnamurthia, Isabelle I. Niyonshutib, Tiffany Marcellea, Leanne E. Mathurinb, Jingyi ChenORCID logo*bcd and Yong Wang (2017) An experiment-based model quantifying antimicrobial activity of silver nanoparticles on Escherichia coli Royal Society of Chemistry
- Montiague EN1, Guzman JPMD1,2, Unciano NM1,3, Panerio EG1, Bigol UG1, Castro IJL , Jose JPG1,4, Mantaring SDA1 (2017) Biodecolourization of Textile Dye and Wastewaters by Crude Laccase from Pleurotus florida ITDI 6003 Cultivated in Wheat Grains Current Research in Environmental & Applied Mycology
- Catalog Number
C40-Touch-IMP - Supplier
Implen - Size
- Shipping
RT
